The g-value plays a crucial role in EPR (Electron Paramagnetic Resonance) spectroscopy in understanding the electronic structure and magnetic properties of paramagnetic substances. Today, we will talk about the key factor in EPR spectroscopy: the g-value (g-factor).
The g-value is a dimensionless quantity that represents a constant of proportionality between the magnetic field and the energy difference between the energy levels in the system. The g-value can be obtained by measuring the resonance frequency of a paramagnetic substance absorbing electromagnetic radiation in the presence of a magnetic field. It represents the extent to which the electron spin interacts with the external magnetic field. The g value is commonly used to determine important characteristics of paramagnetic substances, such as the number of unpaired electrons and their orbital angular momentum.
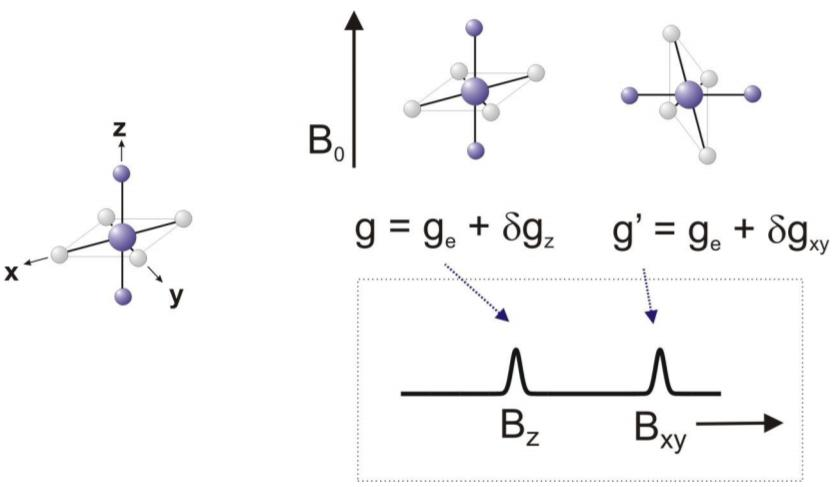
For a free electron, the g value is a constant of 2.0023, derived from fundamental physical properties. However, in more complex systems, such as transition metal complexes or organic radicals, the g value can deviate from this standard value. The deviation arises due to various factors, including spin-orbit coupling and hyperfine interactions with nearby nuclei. These interactions introduce additional energy levels and modify the electron's behavior in the magnetic field, leading to different g values.
By analyzing the g value in EPR spectroscopy, scientists can gain insights into the molecular structure and chemical environment of the paramagnetic species under investigation. A change in the g value can reveal the presence of different ligands or coordination environments around a metal ion, providing valuable information about the electronic configuration and coordination chemistry.
 g value in epr spectroscopy
In addition, the g-value can be used to study the dynamics of a system. For example, it can provide information about the rate of electron transfer or spin relaxation processes, revealing the kinetics and mechanisms involved in chemical reactions or biological processes.
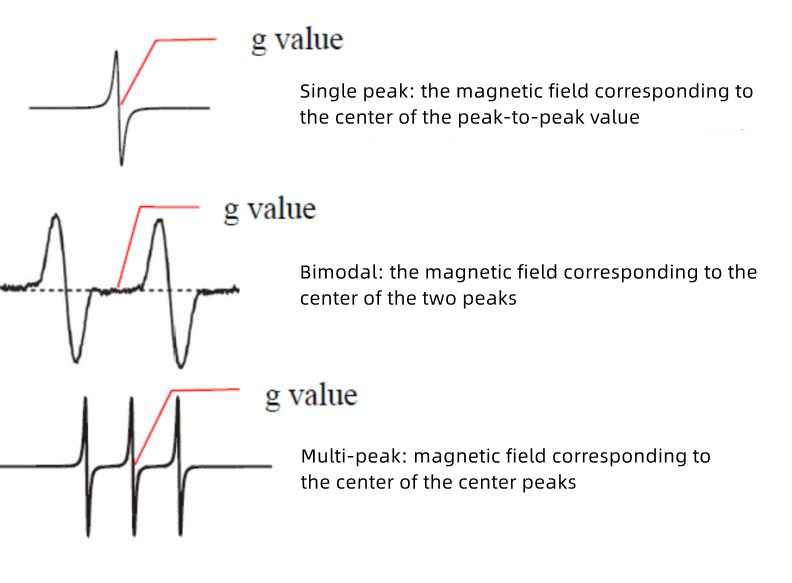
A common method of measuring the g-value is using EPR spectroscopy on a sample with a known g-value. This reference sample can be a compound with a well-characterized g-value or a spin probe, such as a stable organic radical. By comparing the position and shape of the resonance signals of the reference sample and the sample of interest, the g-value of the unknown species can be calculated.
Another approach involves calculating the g value from the Zeeman effect. The Zeeman effect describes the splitting of energy levels in a magnetic field. By measuring the magnetic field strength required to observe resonance at different frequencies, the g value can be derived using the equation g = hν/μBΔB, where h is Planck's constant, ν is the microwave frequency, μB is the Bohr magneton, and ΔB is the magnetic field difference between the resonance peaks.
In addition, the g value can be determined by analyzing the linewidth of the EPR signal. Since the g value depends on the orientation of the unpaired electrons in the magnetic field, any interaction or fluctuation in the environment will broaden the EPR signal. The g-value can be estimated by measuring the linewidth and analyzing its dependence on the magnetic field strength.
It is worth noting that the g value is not always a fixed constant. In some cases, it may vary due to factors such as electron-electron interactions or electrons leaving the domain. These variations can indicate the chemical or physical properties of the paramagnetic substance.
 g value in epr spectroscopy
In summary, the g-value in EPR spectroscopy is an important parameter that helps characterize paramagnetic substances. By determining the g-value, researchers can gain valuable insights into the electronic structure and properties of paramagnetic compounds, contributing to understanding a wide range of scientific disciplines, including chemistry, physics, and biology.
Click here to read more application notes on EPR spectroscopy.